
Business Analytics Services
Turn Business Data into Clear Insights, Better Decisions, and Measurable Growth
Devisgon helps global businesses analyze performance, track KPIs, identify bottlenecks, forecast trends, and convert raw data into actionable business intelligence. We build analytics systems for finance, sales, marketing, operations, customer experience, SaaS platforms, startups, and enterprise teams that need reliable decisions backed by real data.
Our Work.
Their Words.
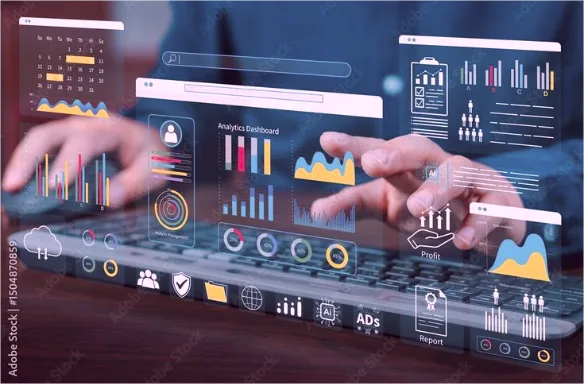
What is Enterprise Grade Business Analytics?
Enterprise grade business analytics is the process of collecting, organizing, analyzing, and visualizing business data to understand performance and improve decision making. It helps companies track KPIs, measure sales, review operations, monitor customer behavior, reduce inefficiencies, and uncover growth opportunities across departments.
At Devisgon, we build analytics solutions that go beyond static reports. Our approach combines data integration, dashboard design, workflow analysis, forecasting, reporting automation, and executive level insights so leadership teams can make faster, clearer, and more confident decisions.
“Business analytics turns scattered operational data into clear insights, smarter strategy, and measurable performance improvement.”

Key Business Benefits
Use analytics to improve visibility, efficiency, forecasting, and strategic decision making
Clear Performance Visibility
Track KPIs across sales, marketing, finance, operations, customers, and internal workflows in one clear view.
Operational Efficiency Gains
Identify bottlenecks, delays, wasted resources, process gaps, and underperforming areas before they affect growth.
Data Driven Strategy
Replace assumptions with reliable reporting, trend analysis, customer insights, and measurable business evidence.
Future Forecasting
Use predictive analytics to forecast demand, revenue, customer behavior, operational needs, and growth opportunities.
What You Receive with Devisgon Business Analytics
1. KPI Strategy and Analytics Planning
We define business goals, key metrics, reporting needs, data sources, decision points, and success criteria.
2. Data Collection and Integration
We connect data from CRMs, databases, spreadsheets, sales tools, marketing platforms, finance systems, and APIs.
3. Dashboards and Reporting Systems
We build clear dashboards, executive reports, operational views, trend charts, and department specific KPI tracking.
4. Workflow and Process Analysis
We analyze operations, handoffs, performance gaps, delays, resource usage, and process improvement opportunities.
5. Predictive Analytics and Forecasting
We create forecasting models for demand, sales, revenue, workload, customer trends, and operational planning.
6. Recommendations and Ongoing Optimization
We provide actionable insights, growth recommendations, reporting improvements, and analytics maintenance over time.
Business Analytics Technologies and Tools We Use
Modern BI, data visualization, analytics, warehouse, automation, and reporting tools for reliable business intelligence
Our Business Analytics Process
A focused 6 step process from discovery to testing, deployment, maintenance, and continuous insight improvement
Discovery Call
We understand your goals, departments, KPIs, data sources, reporting problems, and decision needs.
Data and Process Mapping
We map workflows, systems, data fields, reporting gaps, business questions, and performance metrics.
Analytics Strategy
We define dashboards, reports, forecasting needs, data model, integrations, and rollout plan.
Dashboard and Model Development
We build dashboards, KPI reports, data pipelines, analytics models, and automated reporting flows.
Testing and Deployment
We validate data accuracy, test reports, review calculations, deploy dashboards, and train users.
Maintenance and Optimization
We monitor reports, improve metrics, update data sources, refine dashboards, and optimize insights.
Business Analytics That Improved Cost Visibility and Operational Decision Making
Operational Roadblock
A growing logistics company had rising costs, delivery delays, scattered spreadsheets, and limited visibility into operational performance. Leadership could not clearly identify which routes, teams, or process gaps were creating the biggest cost and service issues.
Our Engineering Approach
Devisgon built a business analytics framework that connected operations data, delivery KPIs, customer feedback, cost metrics, and reporting dashboards. The system highlighted bottlenecks, performance trends, and improvement opportunities across the logistics workflow.
Measurable Impact
The company improved cost visibility, reduced manual reporting work, identified delay patterns faster, and gained a clearer analytics foundation for operational planning and leadership decision making.

Business Analytics Questions and Answers
Detailed answers for founders, executives, operations teams, and business leaders evaluating analytics systems
Ready to turn your business data into actionable insights?
Schedule a business analytics discovery callLet's Build Smarter, Together
Talk to our experts and see how Devisgon can accelerate your business growth with cutting-edge technology solutions.